Invest in the most reliable technical indicators
The most reliable technical indicator for investing: the unemployment curve
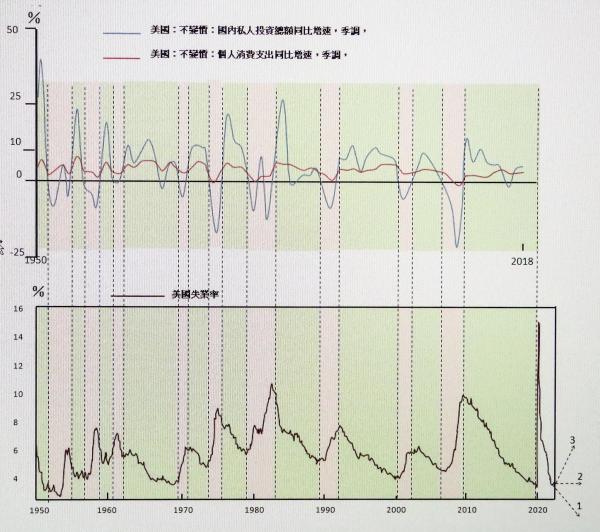
In "Questions and Answers on Major Issues in Economics" (No. 2) and (No. 6), I have added an annex "How to Use the Unemployment Rate Chart to Invest", which is my view based on the theory of economic fluctuations caused by the investment-consumption ratio and the imbalance of the vertical industrial structurehttps://blog.creaders.net/uindex.php see my paper on it. At present United States there have been new developments in the economic situation, which are confirming my view. "How to Invest with Unemployment Rate Charts" was originally published on 22 September 2023 after the article "Questions and Answers on Major Issues in Economics" (Part 2). The original text reads: "The figure below (see Figure 3 for reference) shows United States investment, consumption growth and unemployment

Chart,....Watch the chart of its unemployment rate. We envisage three trends in the unemployment rate after 2023, represented by dotted lines 1, 2, and 3. (1) If there are enough laborers in the sky who continue to fall into production, then the unemployment rate can continue to rush down through the zero unemployment rate line, such as the dotted line 1, and the economy will continue to grow at a high speed, and it will be the same as required by the vertical production structure formed by the previous rapid economic growth, but this is impossible. (ii) The unemployment rate moves steadily forward in the full employment zone, such as the dotted line 2, which is the most ideal equilibrium growth, but the vertical structure of the economy, which has been accumulated since 2010, is completely different from the vertical structure it requires, so the probability of achieving 2 is almost zero. (3) Then the only possibility of the trend of the unemployment rate curve is the dotted line 3. If you look at the trend of the unemployment curve for more than 100 years, when it rushes straight to the full employment zone, it has rebounded like 3 without exception, with the unemployment rate rising, investment contraction, economic growth declining, and the imbalance of the economy corrected. Using this unemployment curve to predict economic fluctuations is more reliable than any investment technology index, because it is not a summary of experience, but is based on a solid theory: when the unemployment rate falls rapidly and rushes to the full employment zone, there must be a serious structural conflict with full employment. Now that the employment rate in the United States has soared to such low levels, I think smart investors know how to do it, and they are much smarter than me. ”
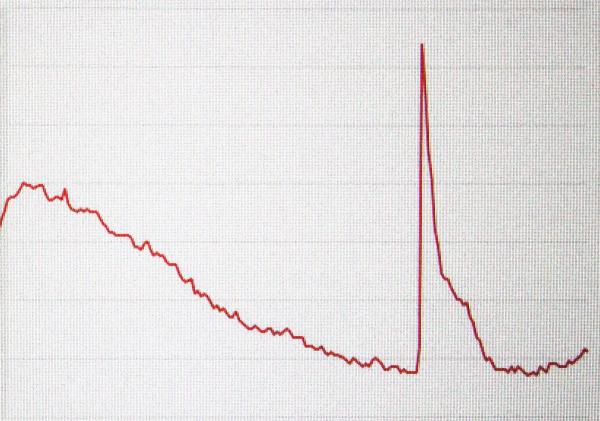
If we omit the part of the unemployment curve in the graph that fluctuated abnormally due to the new crown epidemic and connect the double troughs formed during the period with the dotted line, we can see that the unemployment rate before and after the epidemic should be in a perfect trough zone, which is the longest downward range of the unemployment rate since the 50s of the last century, and hit a new low. The curve shows that in the past 70 years, there has not been a single such decline in the unemployment rate that has not caused a rebound. A rebound in the unemployment rate is a recession, and the Federal Reserve's recent interest rate cut is a symptom of a sharp rebound in the unemployment rate. Many influential political and economic commentators, such as Xiao Ruoyuan and Wu Jialong, have misjudged the economic trend after the United States cut interest rates. My theories in "Questions and Answers on Major Issues in Economics" (2) and (6) show that the only possible trend of the unemployment rate after the unemployment rate fell to a low before and after the pandemic United States the pandemic is dotted line3The unemployment rate rebounded and the economy declined. But they choose the dotted line 2, or even the completely impossible dotted line 1, and the economy is stable or even high. They do not realize that since 2010, the imbalanced structural system that has driven the rapid decline in unemployment and high economic growth in the United States has not changed, and the solid line of the decline in unemployment represents a stubborn structural system behind it, an unbalanced structural system. It is incompatible with the structural system required by the dotted line 2, and is only adapted to the fantastical fact that a large number of unemployed people are constantly falling from the sky and continuing to be put into labor production at the same rate as when the unemployment rate had previously fallen. Therefore, it is impossible to achieve both the dotted lines 1 and 2, which determines that the unemployment rate curve of United States years will inevitably rebound when it rushes to a low level at a high speed. Of course, the degree of imbalance in the vertical structure of the United States economy is not as serious as in China, and the rebound in unemployment and economic recession will be much lighter, but they are still inevitable. Unlike most political and economic commentators, who mostly make judgments based on phenomena, experience, and statistics, I try to make judgments based on basic theories. The current momentum of the United States unemployment rate seems to be confirming my theory and judgment (see chart below), and if nothing else, the next year or two will be a period of rapid rise in the United States labor unemployment rate and a downturn. Of course, readers don't have to care about my point of view, just see if it comes true.
United States unemployment rate since 2010

